PyTorch’s Event And Profiler#
# %pip install -q omniverse==0.0.63
from typing import Callable
import torch
import logging
import sys
from torch.profiler import profile, ProfilerActivity

import pandas as pd
F = Callable[[torch.Tensor], torch.Tensor]

assert torch.cuda.is_available()
device = torch.device("cuda")

logging.basicConfig(
    level=logging.INFO,
    format="%(asctime)s - %(name)s - %(levelname)s - %(message)s",
    handlers=[logging.StreamHandler(sys.stdout)],
    force=True,
)
logger = logging.getLogger(__name__)
Torch Cuda Event#
Recall in our earlier post that CUDA operations are asynchronous and therefore
using timeit naively without synchronization blocks would result in inaccurate
measurements. We could use torch.cuda.Event to have more a more precise timing
too.
def square_by_multiplication(a: torch.Tensor) -> torch.Tensor:
    return a * a


def square_by_exponentiation(a: torch.Tensor) -> torch.Tensor:
    return a**2


def profile_with_event(func: F, input: torch.Tensor, warmup_steps: int = 5) -> float:
    start = torch.cuda.Event(enable_timing=True)  # Create a start event
    end = torch.cuda.Event(enable_timing=True)  # Create an end event

    logger.info(f"Warmup for {warmup_steps} steps to warm up the GPU")
    for _ in range(warmup_steps):
        func(input)

    start.record()
    func(input)
    end.record()
    torch.cuda.synchronize()  # Synchronize the GPU

    time_spent: float = start.elapsed_time(end)
    return time_spent
x = torch.randn(10000, 10000).to(device)
profile_with_event(square_by_multiplication, x)
2024-08-12 04:20:42,732 - __main__ - INFO - Warmup for 5 steps to warm up the GPU
1.480672001838684
Torch Profiler#
Profiling Square Operation#
Below we refer to Christian Mill’s lecture notes on CUDA MODE.
with torch.profiler.profile(
    activities=[
        torch.profiler.ProfilerActivity.CPU,
        torch.profiler.ProfilerActivity.CUDA,
    ]
) as prof:
    torch.square(x)

print(prof.key_averages().table(sort_by="cuda_time_total", row_limit=10))
-------------------------------------------------------  ------------  ------------  ------------  ------------  ------------  ------------  ------------  ------------  ------------  ------------
                                                   Name    Self CPU %      Self CPU   CPU total %     CPU total  CPU time avg     Self CUDA   Self CUDA %    CUDA total  CUDA time avg    # of Calls
-------------------------------------------------------  ------------  ------------  ------------  ------------  ------------  ------------  ------------  ------------  ------------  ------------
                                           aten::square         0.19%      11.000us        76.81%       4.423ms       4.423ms       0.000us         0.00%       1.474ms       1.474ms             1
                                              aten::pow        65.32%       3.761ms        76.62%       4.412ms       4.412ms       1.474ms       100.00%       1.474ms       1.474ms             1
void at::native::vectorized_elementwise_kernel<4, at...         0.00%       0.000us         0.00%       0.000us       0.000us       1.474ms       100.00%       1.474ms       1.474ms             1
                                      aten::result_type         0.03%       2.000us         0.03%       2.000us       2.000us       0.000us         0.00%       0.000us       0.000us             1
                                               aten::to         0.02%       1.000us         0.02%       1.000us       1.000us       0.000us         0.00%       0.000us       0.000us             1
                                       cudaLaunchKernel        11.25%     648.000us        11.25%     648.000us     648.000us       0.000us         0.00%       0.000us       0.000us             1
                                  cudaDeviceSynchronize        23.19%       1.335ms        23.19%       1.335ms       1.335ms       0.000us         0.00%       0.000us       0.000us             1
-------------------------------------------------------  ------------  ------------  ------------  ------------  ------------  ------------  ------------  ------------  ------------  ------------
Self CPU time total: 5.758ms
Self CUDA time total: 1.474ms
STAGE:2024-08-12 04:40:51 34:34 ActivityProfilerController.cpp:312] Completed Stage: Warm Up
STAGE:2024-08-12 04:40:51 34:34 ActivityProfilerController.cpp:318] Completed Stage: Collection
STAGE:2024-08-12 04:40:51 34:34 ActivityProfilerController.cpp:322] Completed Stage: Post Processing
First PyTorch C++ API has a foundational tensor
and mathematical operation library called ATen, which all other operations
are built on top of. Later in the profiling you would see numerous prefixes like
aten:: which indicates the operation is from the ATen library.
The table have some key columns, for instance, the aten::square is an
operation that squares the input tensor element-wise. The aten::pow operation
is used to raise the input tensor to a power element-wise. The
void at::native::vectorized_elementwise_kernel operation is a C++ kernel used
in PyTorch for optimized elementwise operations on the tensor. And one should
also know that squaring can be done in two ways, say given an input \(x\), then we
can either do \(x^2\) or \(x*x\).
The Self Cpu % column shows the percentage of total CPU time spent
exclusively in this operation, not including time in any called subroutines.
What this means is that aten::square uses \(0.17\%\) of the total CPU time by
itself with an absolute amount of \(9\) microseconds. Note that the column
Self Cpu % sums up to \(100\%\) across all operations in the table.
Perhaps the term exclusively would be clearer if we look at the CPU total %
column which represents the total percentage of CPU time spent in this operation
and any operations it calls. So aten::square takes up \(74.27\%\) of the CPU
time including itself and any functions it invokes. Granted that I am really
unsure of the exact operations that aten::square calls because I did not dig
further into the source code, it won’t be surprising that it surely calls
aten::pow operation and probably the
void at::native::vectorized_elementwise_kernel operation. Something like below:
aten::square
└── aten::pow
    └── at::native::vectorized_elementwise_kernel...
And the same concept can be applied to the Self CUDA % and CUDA total %, and
it is not surprising that the aten::square operation does not have any direct
GPU time recorded for it since the real cuda operation is done in the
void at::native::vectorized_elementwise_kernel operation (related to
aten::pow).
df = pd.DataFrame(map(vars, prof.key_averages()))
df[["key", "self_cpu_time_total", "cpu_time_total", "self_cuda_time_total", "cuda_time_total", "device_type"]]
| key | self_cpu_time_total | cpu_time_total | self_cuda_time_total | cuda_time_total | device_type | |
|---|---|---|---|---|---|---|
| 0 | aten::square | 11 | 4423 | 0 | 1474 | DeviceType.CPU |
| 1 | aten::pow | 3761 | 4412 | 1474 | 1474 | DeviceType.CPU |
| 2 | aten::result_type | 2 | 2 | 0 | 0 | DeviceType.CPU |
| 3 | aten::to | 1 | 1 | 0 | 0 | DeviceType.CPU |
| 4 | cudaLaunchKernel | 648 | 648 | 0 | 0 | DeviceType.CPU |
| 5 | void at::native::vectorized_elementwise_kernel... | 0 | 0 | 1474 | 1474 | DeviceType.CUDA |
| 6 | cudaDeviceSynchronize | 1335 | 1335 | 0 | 0 | DeviceType.CPU |
df.sort_values(by="cuda_time_total", ascending=False)
| key | count | node_id | is_async | is_remote | use_device | cpu_time_total | cuda_time_total | privateuse1_time_total | self_cpu_time_total | ... | cuda_memory_usage | privateuse1_memory_usage | self_cpu_memory_usage | self_cuda_memory_usage | self_privateuse1_memory_usage | cpu_children | cpu_parent | device_type | is_legacy | flops | |
|---|---|---|---|---|---|---|---|---|---|---|---|---|---|---|---|---|---|---|---|---|---|
| 0 | aten::square | 1 | -1 | False | False | None | 3974 | 1473 | 0 | 9 | ... | 0 | 0 | 0 | 0 | 0 | [<FunctionEvent id=2562 name=aten::pow device_... | None | DeviceType.CPU | False | 0 |
| 1 | aten::pow | 1 | -1 | False | False | None | 3965 | 1473 | 0 | 3340 | ... | 0 | 0 | 0 | 0 | 0 | [<FunctionEvent id=2563 name=aten::result_type... | <FunctionEvent id=2561 name=aten::square devic... | DeviceType.CPU | False | 0 |
| 5 | void at::native::vectorized_elementwise_kernel... | 1 | -1 | False | False | None | 0 | 1473 | 0 | 0 | ... | 0 | 0 | 0 | 0 | 0 | [] | None | DeviceType.CUDA | False | 0 |
| 2 | aten::result_type | 1 | -1 | False | False | None | 2 | 0 | 0 | 2 | ... | 0 | 0 | 0 | 0 | 0 | [] | <FunctionEvent id=2562 name=aten::pow device_t... | DeviceType.CPU | False | 0 |
| 3 | aten::to | 1 | -1 | False | False | None | 0 | 0 | 0 | 0 | ... | 0 | 0 | 0 | 0 | 0 | [] | <FunctionEvent id=2562 name=aten::pow device_t... | DeviceType.CPU | False | 0 |
| 4 | cudaLaunchKernel | 1 | -1 | False | False | None | 623 | 0 | 0 | 623 | ... | 0 | 0 | 0 | 0 | 0 | [] | <FunctionEvent id=2562 name=aten::pow device_t... | DeviceType.CPU | False | 0 |
| 6 | cudaDeviceSynchronize | 1 | -1 | False | False | None | 1377 | 0 | 0 | 1377 | ... | 0 | 0 | 0 | 0 | 0 | [] | None | DeviceType.CPU | False | 0 |
7 rows × 26 columns
with torch.profiler.profile(
    activities=[
        torch.profiler.ProfilerActivity.CPU,
        torch.profiler.ProfilerActivity.CUDA,
    ]
) as prof:
    square_by_multiplication(x)

print(prof.key_averages().table(sort_by="cuda_time_total", row_limit=10))
-------------------------------------------------------  ------------  ------------  ------------  ------------  ------------  ------------  ------------  ------------  ------------  ------------
                                                   Name    Self CPU %      Self CPU   CPU total %     CPU total  CPU time avg     Self CUDA   Self CUDA %    CUDA total  CUDA time avg    # of Calls
-------------------------------------------------------  ------------  ------------  ------------  ------------  ------------  ------------  ------------  ------------  ------------  ------------
                                              aten::mul        49.96%       2.265ms        70.34%       3.189ms       3.189ms       1.477ms       100.00%       1.477ms       1.477ms             1
void at::native::vectorized_elementwise_kernel<4, at...         0.00%       0.000us         0.00%       0.000us       0.000us       1.477ms       100.00%       1.477ms       1.477ms             1
                                       cudaLaunchKernel        20.38%     924.000us        20.38%     924.000us     924.000us       0.000us         0.00%       0.000us       0.000us             1
                                  cudaDeviceSynchronize        29.66%       1.345ms        29.66%       1.345ms       1.345ms       0.000us         0.00%       0.000us       0.000us             1
-------------------------------------------------------  ------------  ------------  ------------  ------------  ------------  ------------  ------------  ------------  ------------  ------------
Self CPU time total: 4.534ms
Self CUDA time total: 1.477ms
STAGE:2024-08-12 04:43:12 34:34 ActivityProfilerController.cpp:312] Completed Stage: Warm Up
STAGE:2024-08-12 04:43:12 34:34 ActivityProfilerController.cpp:318] Completed Stage: Collection
STAGE:2024-08-12 04:43:12 34:34 ActivityProfilerController.cpp:322] Completed Stage: Post Processing
Trace#
with profile(activities=[ProfilerActivity.CPU, ProfilerActivity.CUDA]) as prof:
    for _ in range(10):
        a = torch.square(torch.randn(10000, 10000).cuda())

prof.export_chrome_trace("default_square_trace.json")
STAGE:2024-08-12 04:44:52 34:34 ActivityProfilerController.cpp:312] Completed Stage: Warm Up
STAGE:2024-08-12 04:45:05 34:34 ActivityProfilerController.cpp:318] Completed Stage: Collection
STAGE:2024-08-12 04:45:05 34:34 ActivityProfilerController.cpp:322] Completed Stage: Post Processing
We can put this json file to chrome://tracing/ to see a flamegraph like visual.
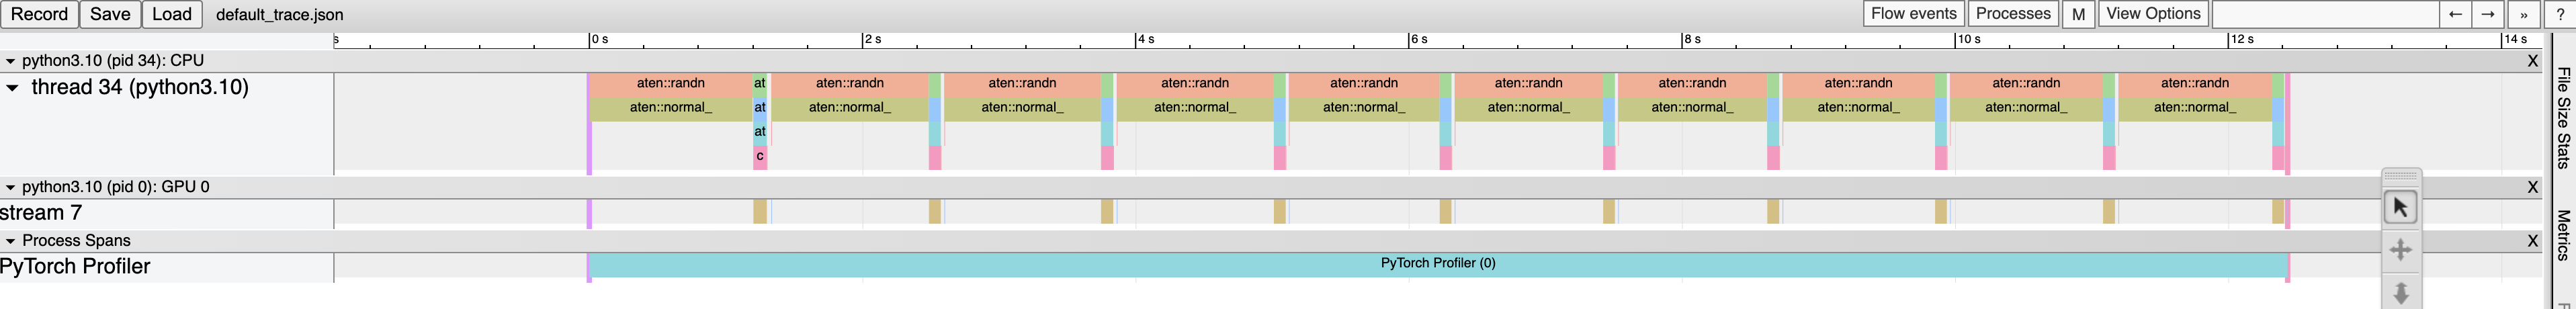
Fig. 38 Trace of the default square operation.#
## With warmup and skip
# Non-default profiler schedule allows user to turn profiler on and off
# on different iterations of the training loop;
# trace_handler is called every time a new trace becomes available
def trace_handler(prof):
    print(prof.key_averages().table(sort_by="self_cuda_time_total", row_limit=-1))
    prof.export_chrome_trace("non_default_trace_" + str(prof.step_num) + ".json")


with torch.profiler.profile(
    activities=[
        torch.profiler.ProfilerActivity.CPU,
        torch.profiler.ProfilerActivity.CUDA,
    ],
    # In this example with wait=1, warmup=1, active=2, repeat=1,
    # profiler will skip the first step/iteration,
    # start warming up on the second, record
    # the third and the forth iterations,
    # after which the trace will become available
    # and on_trace_ready (when set) is called;
    # the cycle repeats starting with the next step
    schedule=torch.profiler.schedule(wait=1, warmup=1, active=2, repeat=1),
    on_trace_ready=trace_handler,
    # on_trace_ready=torch.profiler.tensorboard_trace_handler('./log')
    # used when outputting for tensorboard
) as p:
    for iter in range(10):
        torch.square(torch.randn(10000, 10000).cuda())
        # send a signal to the profiler that the next iteration has started
        p.step()
STAGE:2024-08-12 04:47:44 34:34 ActivityProfilerController.cpp:312] Completed Stage: Warm Up
STAGE:2024-08-12 04:47:47 34:34 ActivityProfilerController.cpp:318] Completed Stage: Collection
STAGE:2024-08-12 04:47:47 34:34 ActivityProfilerController.cpp:322] Completed Stage: Post Processing
-------------------------------------------------------  ------------  ------------  ------------  ------------  ------------  ------------  ------------  ------------  ------------  ------------
                                                   Name    Self CPU %      Self CPU   CPU total %     CPU total  CPU time avg     Self CUDA   Self CUDA %    CUDA total  CUDA time avg    # of Calls
-------------------------------------------------------  ------------  ------------  ------------  ------------  ------------  ------------  ------------  ------------  ------------  ------------
                                            aten::copy_         0.00%     111.000us         6.95%     171.340ms      85.670ms     170.696ms        98.30%     170.696ms      85.348ms             2
                       Memcpy HtoD (Pageable -> Device)         0.00%       0.000us         0.00%       0.000us       0.000us     170.696ms        98.30%     170.696ms      85.348ms             2
                                              aten::pow         0.01%     192.000us         0.01%     278.000us     139.000us       2.951ms         1.70%       2.951ms       1.476ms             2
void at::native::vectorized_elementwise_kernel<4, at...         0.00%       0.000us         0.00%       0.000us       0.000us       2.951ms         1.70%       2.951ms       1.476ms             2
                                          ProfilerStep*         2.01%      49.532ms        99.95%        2.464s        1.232s       0.000us         0.00%     173.647ms      86.823ms             2
                                            aten::randn         0.00%      55.000us        90.97%        2.243s        1.121s       0.000us         0.00%       0.000us       0.000us             2
                                            aten::empty         0.00%      77.000us         0.00%      77.000us      38.500us       0.000us         0.00%       0.000us       0.000us             2
                                          aten::normal_        90.96%        2.242s        90.96%        2.242s        1.121s       0.000us         0.00%       0.000us       0.000us             2
                                               aten::to         0.00%      53.000us         6.96%     171.507ms      42.877ms       0.000us         0.00%     170.696ms      42.674ms             4
                                         aten::_to_copy         0.00%      60.000us         6.95%     171.454ms      85.727ms       0.000us         0.00%     170.696ms      85.348ms             2
                                    aten::empty_strided         0.00%      54.000us         0.00%      54.000us      27.000us       0.000us         0.00%       0.000us       0.000us             2
                                        cudaMemcpyAsync         6.94%     171.179ms         6.94%     171.179ms      85.590ms       0.000us         0.00%       0.000us       0.000us             2
                                  cudaStreamSynchronize         0.00%      50.000us         0.00%      50.000us      25.000us       0.000us         0.00%       0.000us       0.000us             2
                                           aten::square         0.00%       9.000us         0.01%     287.000us     143.500us       0.000us         0.00%       2.951ms       1.476ms             2
                                      aten::result_type         0.00%       3.000us         0.00%       3.000us       1.500us       0.000us         0.00%       0.000us       0.000us             2
                                       cudaLaunchKernel         0.00%      83.000us         0.00%      83.000us      41.500us       0.000us         0.00%       0.000us       0.000us             2
                                  cudaDeviceSynchronize         0.05%       1.323ms         0.05%       1.323ms       1.323ms       0.000us         0.00%       0.000us       0.000us             1
-------------------------------------------------------  ------------  ------------  ------------  ------------  ------------  ------------  ------------  ------------  ------------  ------------
Self CPU time total: 2.465s
Self CUDA time total: 173.647ms